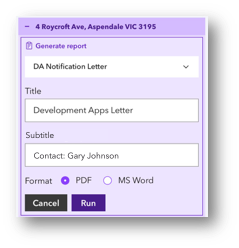
Using Geovonic Connect reporting, the widget user can choose to generate a report based on the selected map features. The generated report can contain values from both the map feature and any layer links associated with the feature layer.
Templates are created using MS Word and then uploaded to the reporting library in Geovonic Connect.
The report generator utilizes a simple templating language that allows you to incorporate dynamic content within Word documents. This language uses curly braces { } to enclose variables, loops, conditionals, and maps.
Starting with a pre-generated sample report
After creating a new report definition in the Geovonic Connect dashboard, you can download a sample report template. This sample is a handy starting point for creating your MS Word template. It contains examples of all available fields that you can use in your report both from the map feature and the layer links.
It is strongly recommended that you start from the pre-generated sample as this provides the correct tag names for each of the fields in your map features and linked records.
Creating a very basic template
Perhaps the most basic template might look something like this: –
Report Title: Property Report

Report Date: {r.currentDate}
When the report is generated, the {r.currentDate} tag will be replaced with today’s date.
Adding variables to your template
There are three types of variables you can add to your template: –
- Report variables – these relate to the report template itself, or variables relating to how the report is being generated.
- Feature attributes – populated with values taken from the selected feature’s attribute data.
- Layer link data – data that has been retrieved from a Geovonic Connect layer link query.
In this example, some feature attributes are included in the output to print the properties address and type.
Report Title: Property Report ({f.address_line1})

Report Date: {r.currentDate}

Property Type: {f.prop_type}
For each feature, it is possible that there could be zero, one or many records returned from a layer link query. For this reason, when outputting layer link data, it must be described within a loop using the {#layerLinks_123} tag. The section is closed using {/layerLinks_123}
In this example, data from a layer link query has been included to print a list of the names of all owner occupiers. The id of each layer link can be found in the sample template download.
Report Title: Property Report ({f.address_line1})

Report Date: {r.currentDate}

Property Type: {f.prop_type}

Owner Occupiers:

{#layerLinks_123}
{ll.firstName} {ll.lastName}
{/layerLinks_123}
Working with tables
You can include tables in your report template. If you want to include a table with rows for each record returned from a layer link query, use this format.
In this example, the table will have a row for each person returned from the query. Each row will have the person’s name and email address.
Full Name |
Email Address |
{#layerLinks_123}{ll.firstName} {ll.lastName} |
{ll.email}{/layerLinks_123} |
Including a Map
To include a map in your report, use the {r.mapImage} tag. The tag will be replaced with a map showing the current feature highlighted.
You can configure the map image generated in the report by defining specific parameters depending on the desired image dimension and the feature type.
{r.mapImage|point:10meters|polygon:2|polyline:1|width:400|height:600}
If no value specified, it will fallback to the default settings; a point feature uses a geodesic buffer of 18 meters and a non-point feature (polygon and polyline) uses an expand factor of 1.5. Supported units for point feature are meters, kilometers, feet, yards, miles, and nautical-miles.
Formatting and Styling Your Template
You can format and style your report template as you would any Word document. The report generator will maintain the formatting and styles when generating the final report.
Variables can also be included in the header and footer if required.
Date Formatting
Dates that are stored in a machine-readable form can be formatted for output in the report. For example, a date that is stored using ISO-8601 format (2023-04-28 13:45:16) can be displayed in a more understandable user readable format.
To format a date, include the date format in the tag separated by a pipe symbol.
{r.currentDate|DD/MM/YYYY}
In this example, the date will be written as 28/04/2023.
Report Title: Property Report ({f.address_line1})

Report Date: {r.currentDate|DD/MM/YYYY}
A list of the formatting options available can be found here: –
https://day.js.org/docs/en/display/format
Prompted Values
The user can be prompted to enter values in the Geovonic Connect widget to be populated into the report.
To include a user entered value in the report use the {r.promptField|Report Title} tag. The tag must start with r.PromptField and then a user friendly prompt text is included after the pipe symbol.
In this example, the user will be prompted to provide a title and sub-title for the report.
Report Title: {r.PromptField|Title}

Subtitle: {r.PromptField|Subtitle}
When the user runs the report, they will be prompted for a title and subtitle.
